The next application of Fibonacci will be to determine “take profit” targets.
Let us begin with an example of an upward trend.
The general principle in an upswing is to take profits on a long trade at a Fibonacci Price Extension Level.
Three mouse clicks are required to establish the Fibonacci extension levels.
Click on a major Swing Low first, then drag your pointer to the most recent Swing High. Finally, return your pointer to the bottom of the screen and click on any of the retracement levels.
This will show both the ratio and the corresponding price levels for each of the Price Extension Levels. Isn’t it amazing?
Let’s return to the USD/CHF chart from the last course as an example.
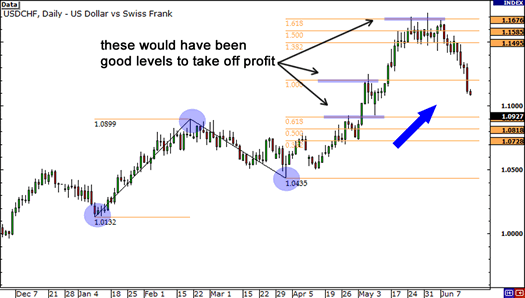
Here’s a recap of what happened after the retracement Swing Low occurred:
- Price rallied all the way to the 61.8% level, which lined up closely with the previous Swing High.
- It fell back to the 38.2% level, where it found support
- Price then rallied and found resistance at the 100% level.
- A couple of days later, the price rallied yet again before finding resistance at the 161.8% level.
As the example shows, the 61.8%, 100%, and 161.8% levels would have all been appropriate opportunities to collect profits.
Now consider an example of employing Fibonacci extension levels in a downtrend.
The overall approach in a decline is to take profits on a short trade at a Fibonacci extension level, as the market frequently finds support at these levels.
Let’s revisit the downtrend on the 1-hour EUR/USD chart that we showed you in the Fib Sticks lesson.

A doji formed just below the 61.8% Fib level. Price then reversed as sellers re-entered, bringing it all the way back down to the Swing Low.
Let’s use the Fib Extension tool to determine where we could have taken profits if we had shorted at the 61.8% retracement level.

Here’s what happened after the price reversed from the Fibonacci retracement level:
Price found support at the 38.2% level
The 50.0% level held as initial support, then became an area of interest
The 61.8% level also became an area of interest, before price shot down to test the previous Swing Low
If you look ahead, you’ll find out that the 100% extension level also acted as support
Profits might have been taken at 38.2%, 50.0%, or 61.8%. All of these levels functioned as support, probably because other traders were looking for these levels to profit from as well.
The examples show that price finds some temporary support or resistance at Fibonacci extension levels – not always, but frequently enough to accurately modify your position to take profits and limit your risk.
Of course, there are some issues to address here.
First, it is impossible to predict which Fibonacci extension level will give resistance.
ANY of these levels can operate as either support or resistance.
Another issue is deciding which Swing Low to begin with when generating Fibonacci extension levels.
One method is to start from the most recent Swing Low, like we did in the examples, and another is to start from the lowest Swing Low in the previous 30 bars.
Again, there is no one proper method to do it, but with a lot of experience, you’ll be able to make better Swing point judgments.
You must use caution when utilizing the Fibonacci extension tool. You must determine how long the trend will continue. We will later show you strategies for determining the strength of a trend.
For the time being, let’s move on to stop loss placement!