Let’s look at a chart to see if there are any potential breakout trades using pivot points. The EUR/USD 15-minute chart is shown below.

The EUR/USD pair produced a strong rally throughout the day.
The EUR/USD opened with a gap up above the pivot point. Price rose sharply before briefly stalling at R1.
Resistance was eventually broken, and the pair increased by 50 pips!
If you had chosen the aggressive approach, you would have captured the first move and celebrated like you just won the World Cup.
If, on the other hand, you had taken the safe route and waited for a retest, you would have been a very unhappy trader. After breaking R1, the price did not retest it. In fact, R1 and R2 experienced the same event!
Take note of how the EUR/USD bulls attempted to make a push for R3.
If you had taken the aggressive approach, however, you would have been trapped in a fakeout when the price failed to sustain the initial break. You would have been stopped out if your stop was too tight.
However, as time goes on, you’ll notice that the price eventually broke through. Take note of the retest of the broken resistance line.
Also, notice how the pair reversed later in the day and broke through R3. There was an opportunity to go short on the resistance retest. -turned-support-turned resistance
One of the most difficult aspects of taking breakout trades is deciding where to place your stop.
In contrast to range trading, where you search for breaks of pivot point support and resistance levels, you want powerful quick moves.
In principle, once a level breaks, it will likely become “support-turned-resistance” or “resistance-turned-support.” Again, this is referred to as a role reversal… because the roles have been switched
If you were long and the price broke R1, you might set your stop loss exactly below R1. Return to the EUR/USD chart to see where you could put your stops.
Setting goals is normally done by aiming for the next pivot point support or resistance level as your take profit point.
Unless there is a major economic event or unexpected news, price will rarely break through all of the pivot point levels. Return to the EUR/USD chart to see where you would place your stops and take profit.
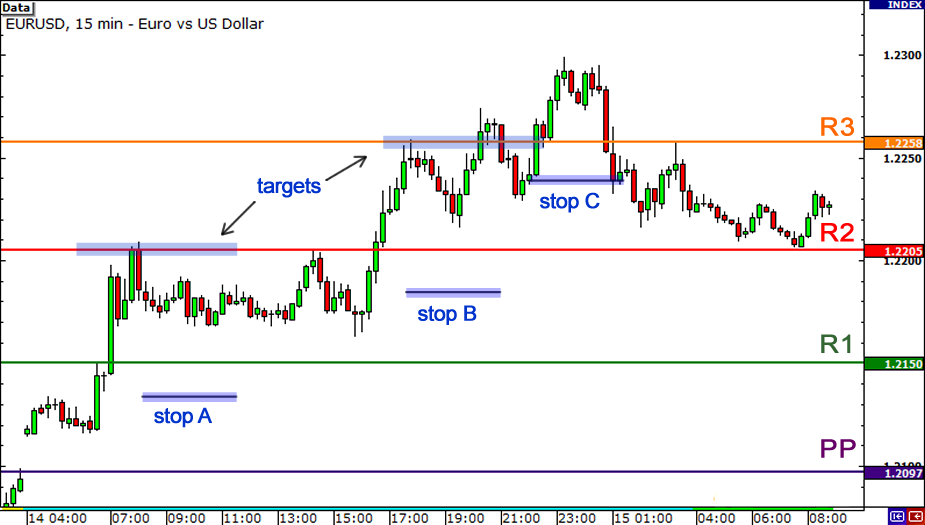
In this case, if you saw the price breach R1, you would put your stop slightly below R1.
If you thought the price would continue to rise, you could hold your position and manually move your stop to see if the trend would continue.
You’d have to keep an eye on things and modify accordingly. This will be covered in greater detail in subsequent lessons.
You must be conscious of the dangers of taking breakout trades, just as you must be aware of the risks of any approach or indicator.
First and foremost, you have no notion whether the move will continue. You may enter believing that the price would continue to rise but instead you catch a top or bottom, indicating that you have been tricked!
Second, you won’t know whether it’s a legitimate breakthrough or simply crazy moves triggered by the revelation of important news.
Volatility spikes are prevalent during news events, so stay up with breaking news and be aware of what’s on the economic calendar for the day or week. Finally, as with range trading, it is best to pop on other significant support and resistance levels.
You may believe that R1 is breaking, but you have overlooked a solid resistance level immediately past R1.
Price may burst through R1, test the resistance, and then fall back. Use your forex knowledge of support and resistance, candlestick patterns, and momentum indicators to help you deliver stronger signals about whether the break is legitimate or not.