What’s the difference between the Dow S&P 500 and Nasdaq?
The specific distinction between the Nasdaq, the Dow, and the S&P 500 is not well-known among traders.
Do you understand how to use the various stock indices?
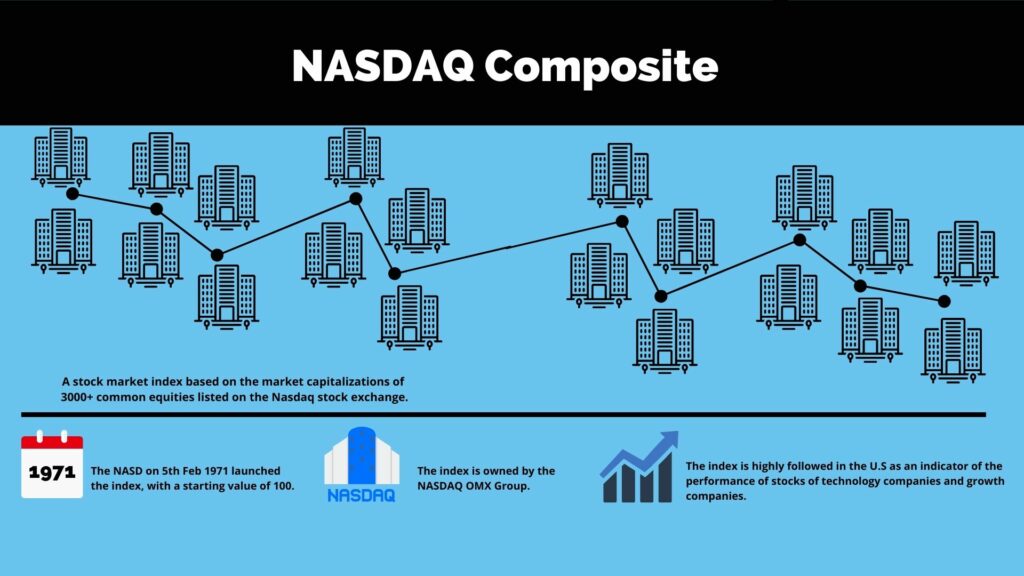
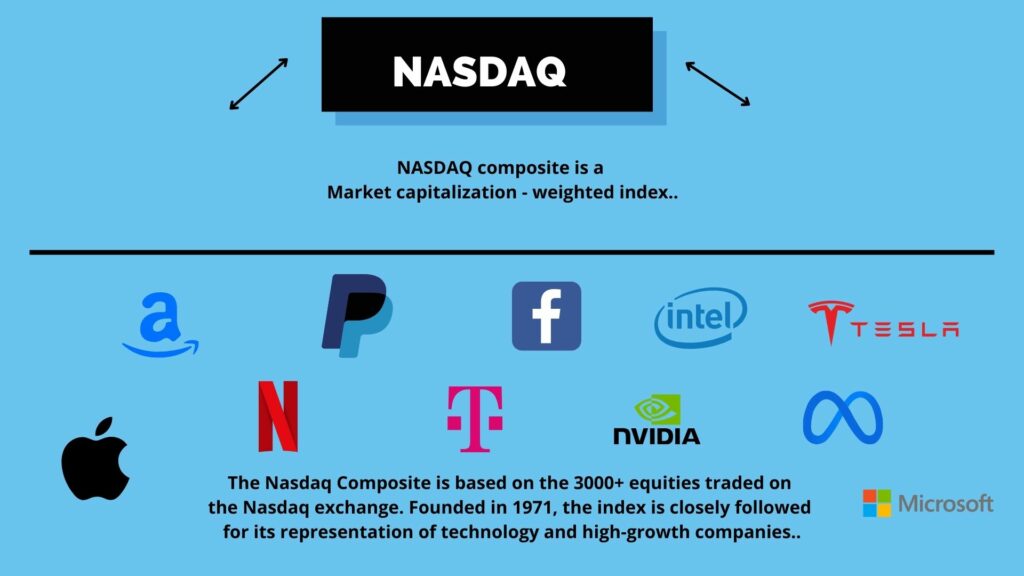
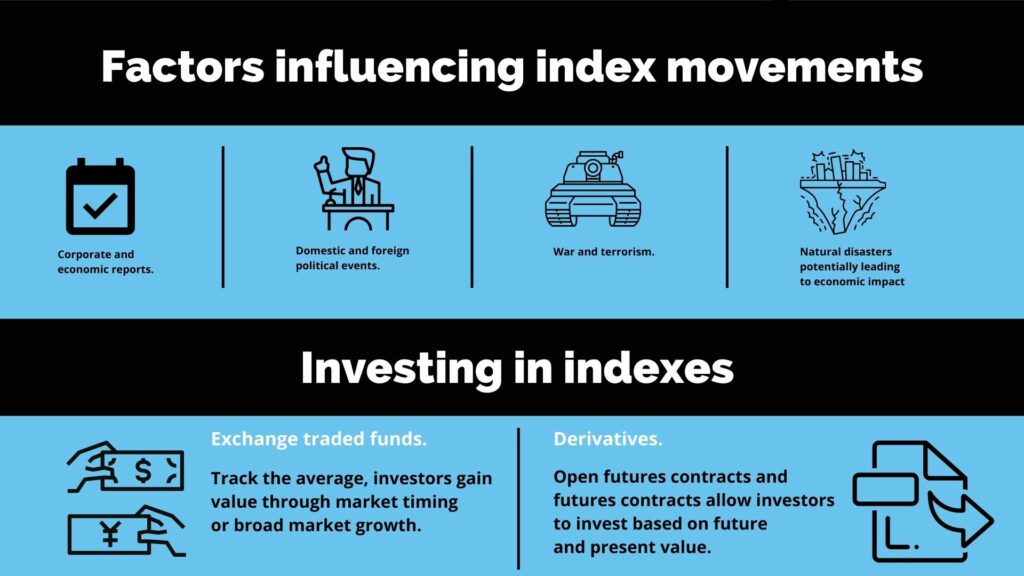
Investors can clearly see the state of the economy generally thanks to the Dow, NASDAQ, and S&P 500 indexes, three of the strongest measures of trade activity.
Each displays a unique type of index that is calculated and tracked in a unique way.
For your convenience, I have created a helpful image that clearly illustrates the key distinctions and makes everything immediately evident.

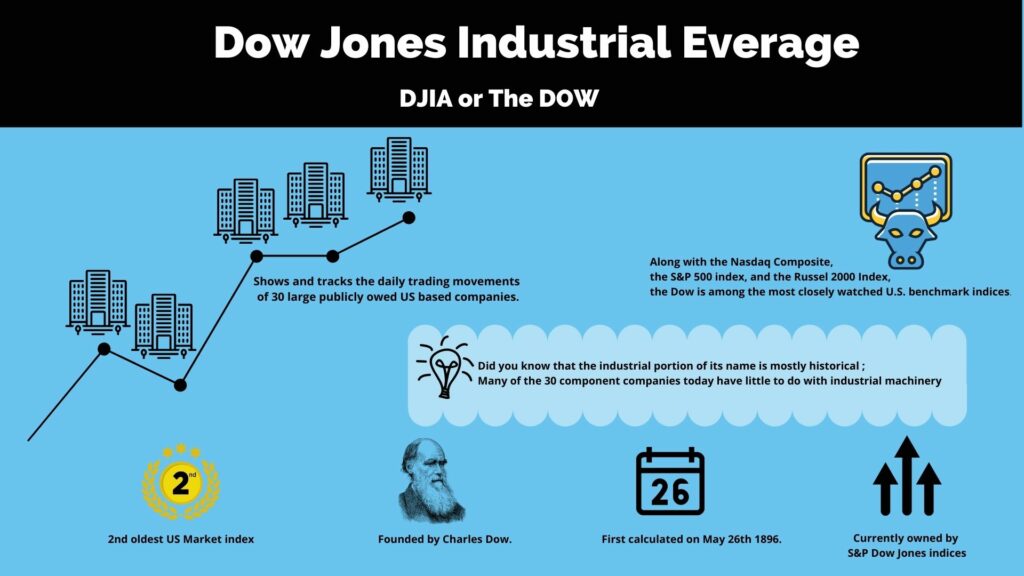
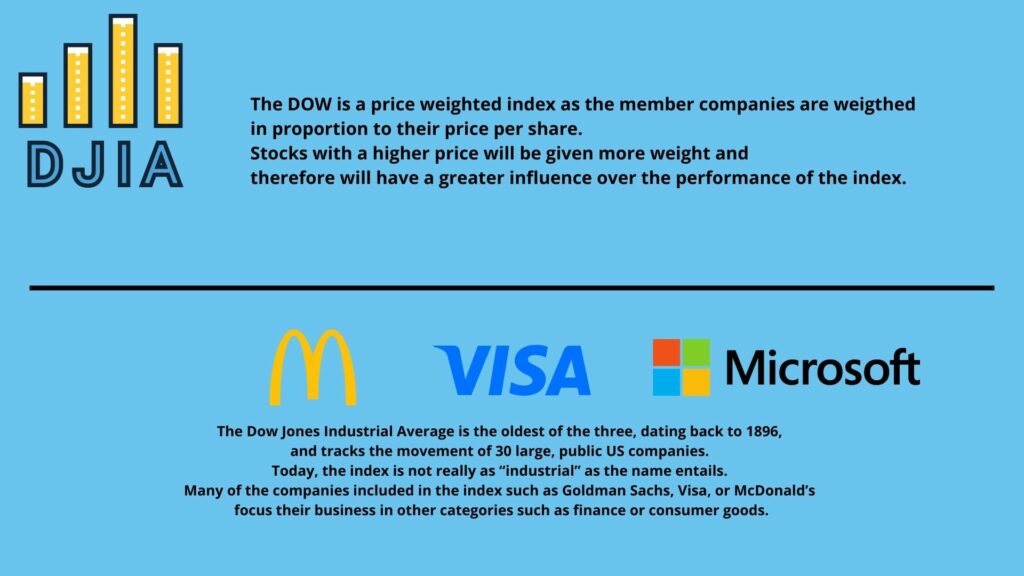
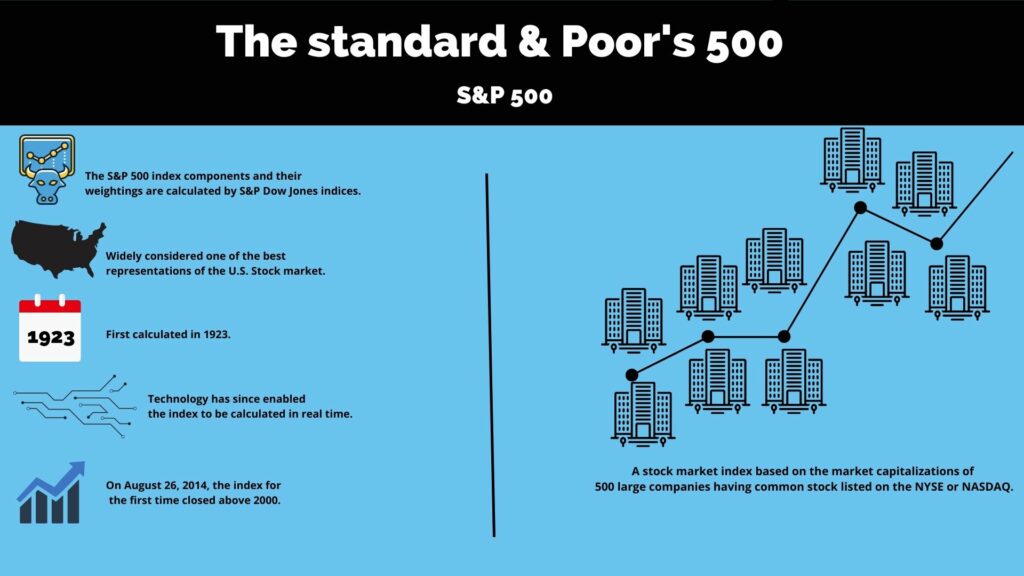
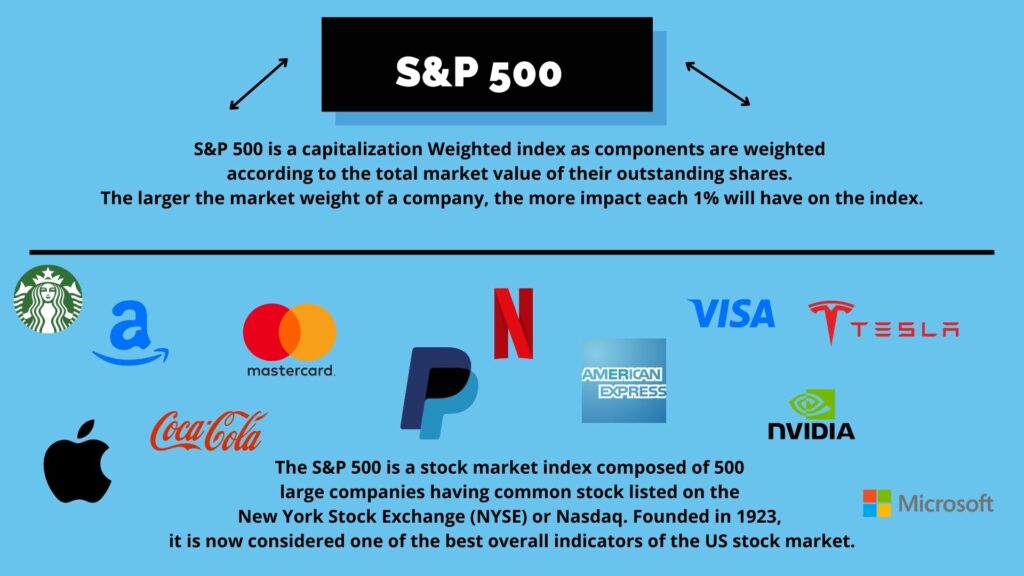
I hope the aforementioned pictures helped to clarify the distinction.
At least I tried to make sense of everything and give you the clearest, most straightforward explanation I could.
I’ll include a few images of the charts below.
Consequently, the movements are also visible on the charts.
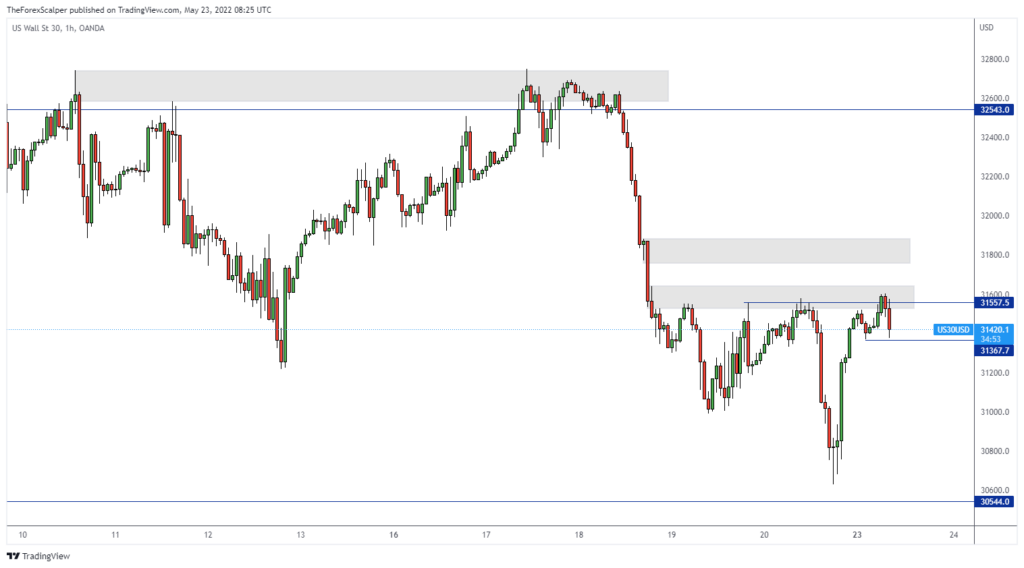
Let’s start with the US30, which I believe many of you traded or maybe considered trading.
And those who follow me or are familiar with me know that I enjoy trading US30 a lot.
Trading US30 is a lot of fun for me.
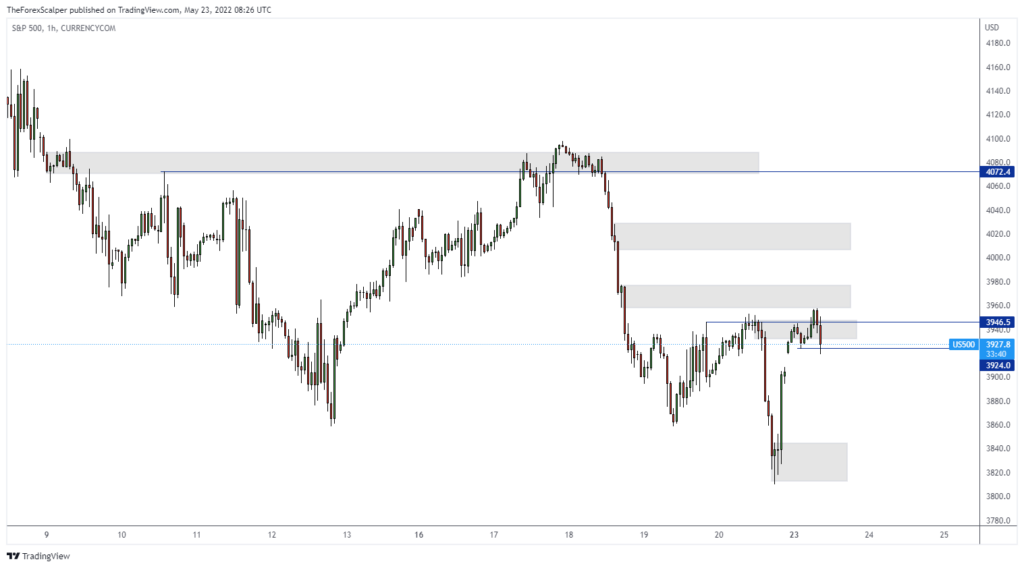
Above we see the S&P 500 which I also have in my list.
Do you see that the US30 and S&P 500 charts are quite similar in terms of movements?
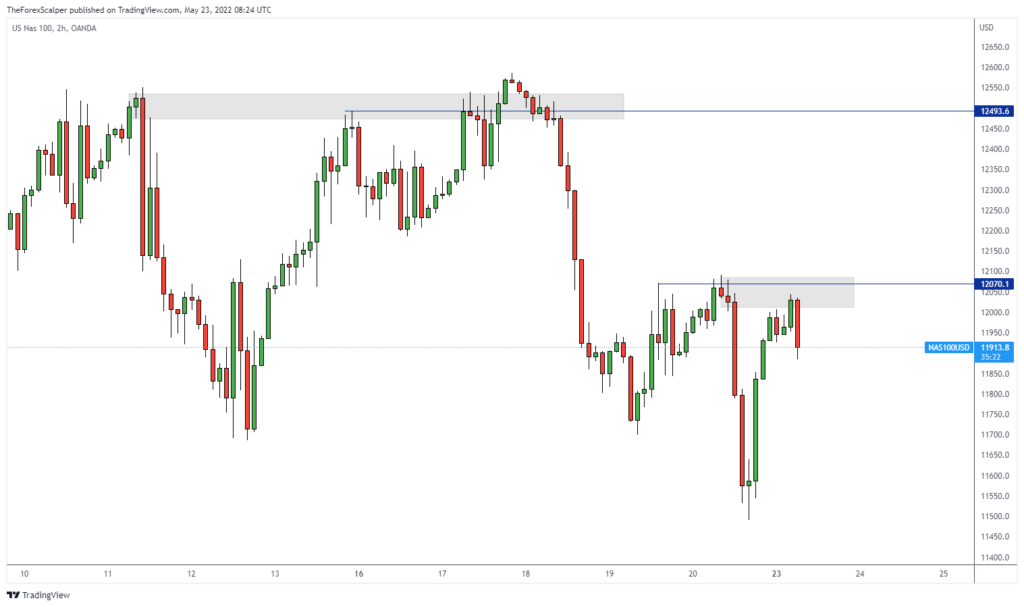
The NASDAQ chart, which also corresponds to the US30 and the S&P 500, is shown here as the last example.
Even if you trade the US30, for instance, it is still a good idea to keep this chart in your setup.