The usual method of calculating pivot points is NOT the sole way to do so.
Traders have sought to improve the original pivot point, and there are now additional methods for calculating pivot points.
In this course, we will discuss these various approaches and provide you with the formulas for calculating these levels.
Woodie Pivot Point
R2 = PP + High – Low
R1 = (2 X PP) – Low
PP = (H + L + 2C) / 4
S1 = (2 X PP) – High
S2 = PP – High + Low
C – Closing Price, H – High, L – Low
The pivot point computation in the calculations above differs significantly from the typical method.
In addition, the difference between the previous day’s high and low, also known as the range, would be used to compute the equivalent support and resistance levels.
Here’s a graphic showing the Woodie pivot point computation on EURUSD.
The solid lines reflect the Woodie pivot point, support levels, and resistance levels, while the dotted lines show the levels calculated using the traditional method.
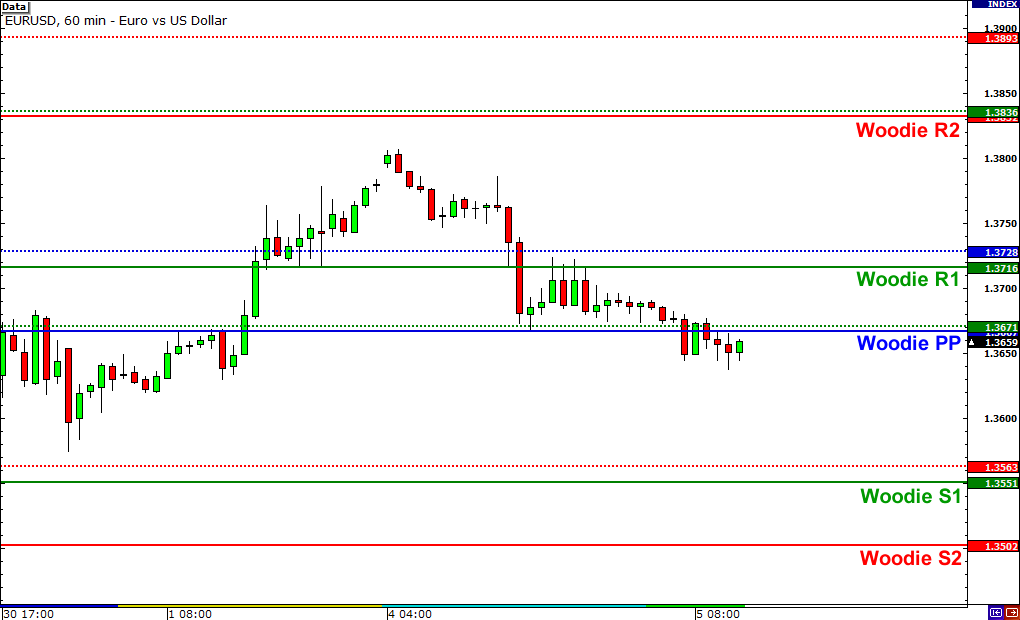
Because they use distinct formulas, the levels obtained by the Woodie computations differ greatly from those derived by the usual method.
Some traders prefer to utilize the Woodie formulas because they give more weight to the prior period’s closing price.
Others support conventional formulas since many traders utilize them, perhaps making them self-fulfilling.
In any event, because resistance can become support (and vice versa), if you employ the Woodie formulae, you should keep a watch on these levels as they may become regions of interest. Whatever makes you happy!
Camarilla Pivot Point
R4 = C + ((H-L) x 1.5000)
R3 = C + ((H-L) x 1.2500)
R2 = C + ((H-L) x 1.1666)
R1 = C + ((H-L) x 1.0833)
PP = (H + L + C) / 3
S1 = C – ((H-L) x 1.0833)
S2 = C – ((H-L) x 1.1666)
S3 = C – ((H-L) x 1.2500)
S4 = C – ((H-L) x 1.5000)
C – Closing Price, H – High, L – Low
Camarilla formulations are comparable to Woodie formulas. They also calculate support and resistance levels based on the previous day’s closing and range.
The only difference is that you must calculate for 8 major levels (4 resistance and 4 support) and multiply each of these levels by a multiplier.
The primary notion behind Camarilla pivot points is that pricing has a natural propensity to revert back to the mean (sound familiar? ), or in this case, the previous day’s close. The concept is to purchase or sell when the price reaches the third support or resistance level.
However, if the price breaks through S4 or R4, it indicates that the intraday trend is strong, and it’s about time you get on board!
Examine how the Camarilla calculation yields different levels (solid lines) than the traditional method (dotted lines)!
As shown in the chart above, the closing price is given greater weight than the pivot point.
As a result, resistance levels may be lower than the pivot point, while support levels may be higher.
Notice how every level of support and resistance is above the Camarilla pivot point?
Fibonacci Pivot Point
R3 = PP + ((High – Low) x 1.000)
R2 = PP + ((High – Low) x .618)
R1 = PP + ((High – Low) x .382)
PP = (H + L + C) / 3
S1 = PP – ((High – Low) x .382)
S2 = PP – ((High – Low) x .618)
S3 = PP – ((High – Low) x 1.000)
C – Closing Price, H – High, L – Low
To establish Fibonacci pivot point levels, first calculate the pivot point using the usual approach.
After that, double the previous day’s range by its Fibonacci level. In their calculations, most traders employ the 38.2%, 61.8%, and 100% retracements.
Finally, add or subtract the digits from the pivot point to get your Fibonacci pivot point levels!
Examine the graphic below to observe how the levels estimated using the Fibonacci approach (solid lines) differ from those computed using the traditional method (dotted lines)
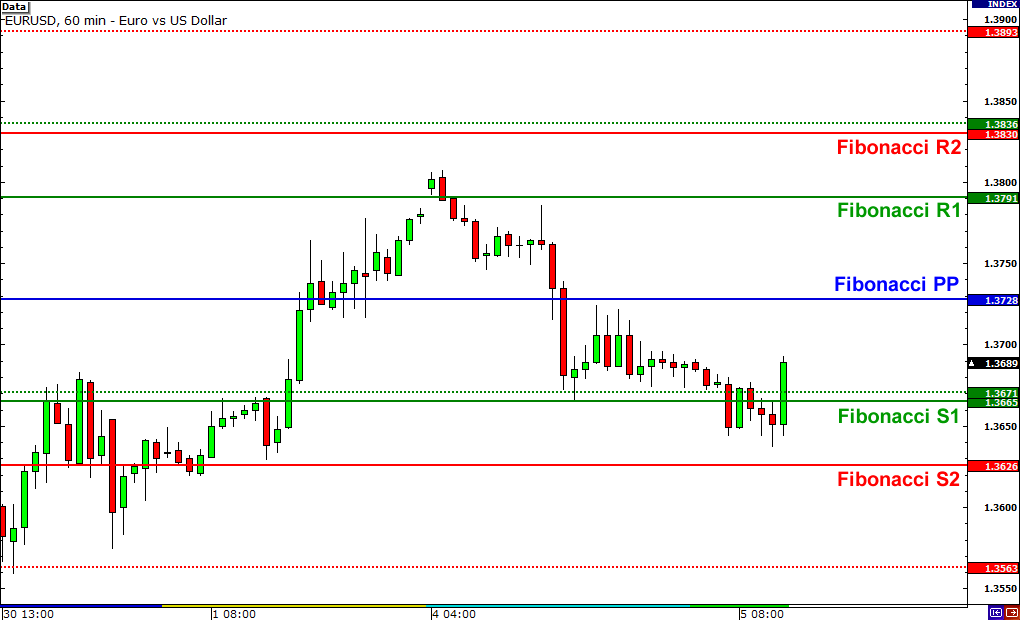
The reasoning behind this is that many traders enjoy employing Fibonacci ratios. It is used for retracement levels, moving averages, and other purposes.
Why not also use it for pivot points?
Keep in mind that Fibonacci and pivot point levels are both used to determine support and resistance.
Because so many traders are looking at these levels, they can become self-fulfilling.
Which Pivot Points Method is the Best?
The truth is that, like all of the other signs you’ve learned so far, there is no single optimal technique.
It all comes down to how you integrate your understanding of pivot points with the rest of the tools in your trading toolbox.
Just keep in mind that most charting software that performs automatic calculations uses the usual way to calculate pivot point levels.
However, now that you know how to compute these values on your own, you may experiment with them all to determine which one works best for you. Make a pivot!
Next Lesson: What is Heiken Ashi?